TracNav
- Home
General Information
- Conceptual Details
- Architectural Details
- For Developers
- Examples
- Downloads
- Documentation
- Credits and Licences
- Legal Issues / Impressum
AutoQUEST Core Library
AutoQUEST Plug-ins
Java Foundation Classes
Microsoft Foundation Classes
HTML- and JavaScript-based Web Applications
PHP-based Web Applications
Generic Event Plugin
- GUITAR
AutoQUEST Frontend
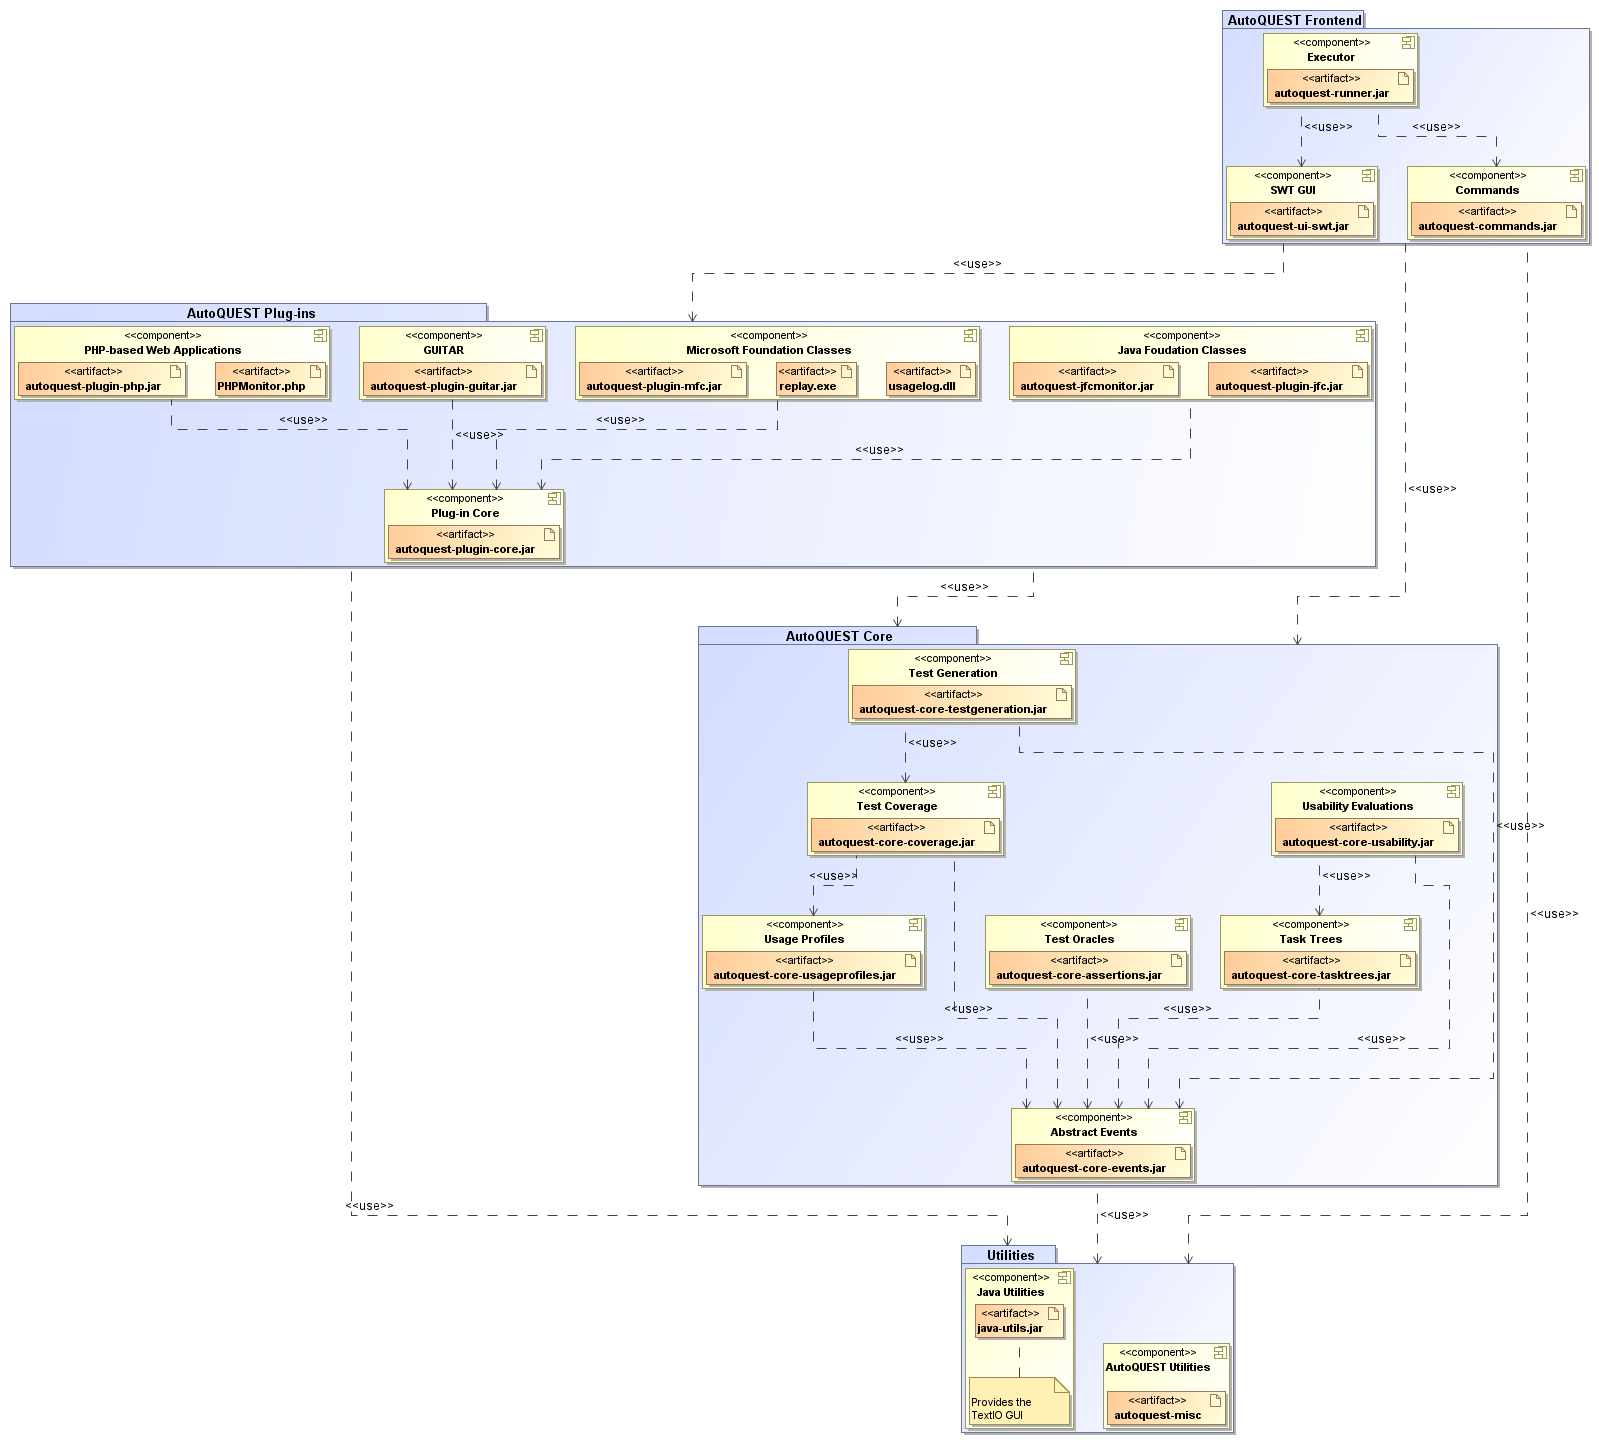
Architecture
The two most important parts of the AutoQUEST architecture are the AutoQUEST Core and the AutoQUEST Plug-ins. The AutoQUEST Core bundles all platform-independent parts defined of the conceptual framework on which AutoQUEST is based (see GeneralInformation/Concept), while the AutoQUEST Plug-ins contain the translation layer and platform layer components. The architecture is completed by the AutoQUEST Frontend package that provides user interfaces and an AutoQUEST Utilities package that contains supporting components.
The AutoQUEST Core consists of multiple sub packages. The most central of them contains a generic representation for events and GUI structures. In addition, there are two dedicated packages for usage model generation, i.e., usage profiles and task trees. For further analysis, the core provides sub packages for coverage and usability analyses.
A plugin for AutoQUEST usually consists of two components. The first serves as monitor for events (platform layer), the second as converter for the recorded events to feed them into AutoQUEST (translation layer). For example, the HTML plug-in has an HTML Monitor which is an HTTP server. This serves a JavaScript? which is integrated into a website for monitoring the usage. The JavaScript? transfers the monitored events to the server which stores them on the disk. This together forms the platform layer. In addition, the plug-in has a component that is loaded in AutoQUEST at runtime, i.e., the actual plug-in. This component is able to read the data stored by the monitor and translate it into the generic event representation of AutoQUEST. Through this, it forms the translation layer. Afterwards, the data can be processed further using the functionalities of the AutoQUEST core.
The AutoQUEST frontend is divided into the console interface and the GUI. From the main processing capabilities, both interfaces serve the same functionality. But the console interface allows for using AutoQUEST in a script mode, which is helpful for larger data processing in case studies. The GUI on the other hand has a much more effective way of visualizing data and analysis results. It is also possible to process data using the console interface and then visualize the data using the GUI afterwards. For this, both interfaces allow for storing and loading processed data and analysis results on disk.
Attachments (1)
- ImplementationDiagram.png (249.0 KB) - added by sherbold 14 years ago.
Download all attachments as: .zip